Sellers
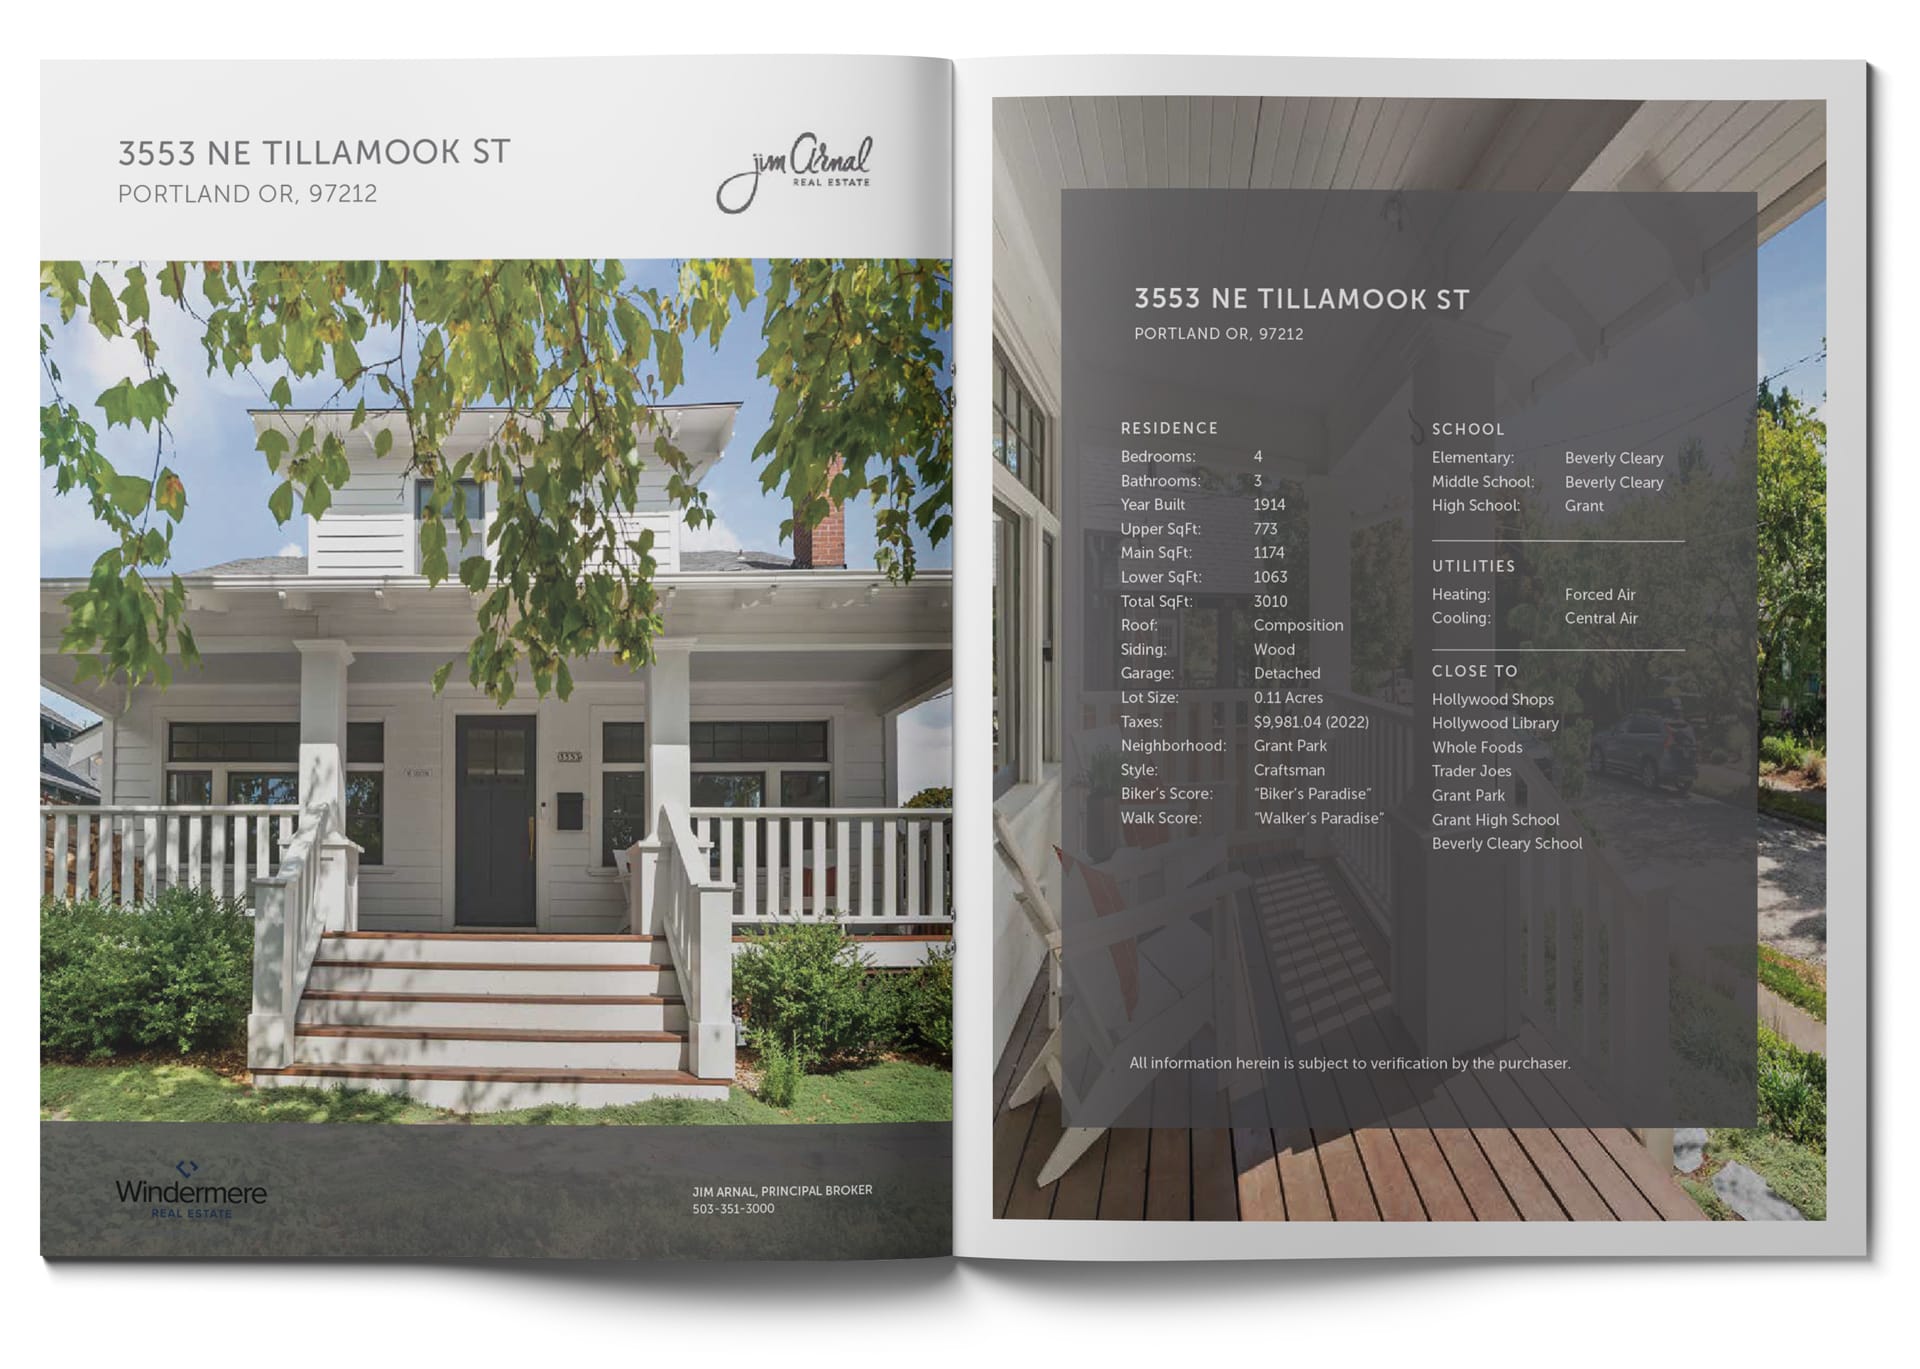
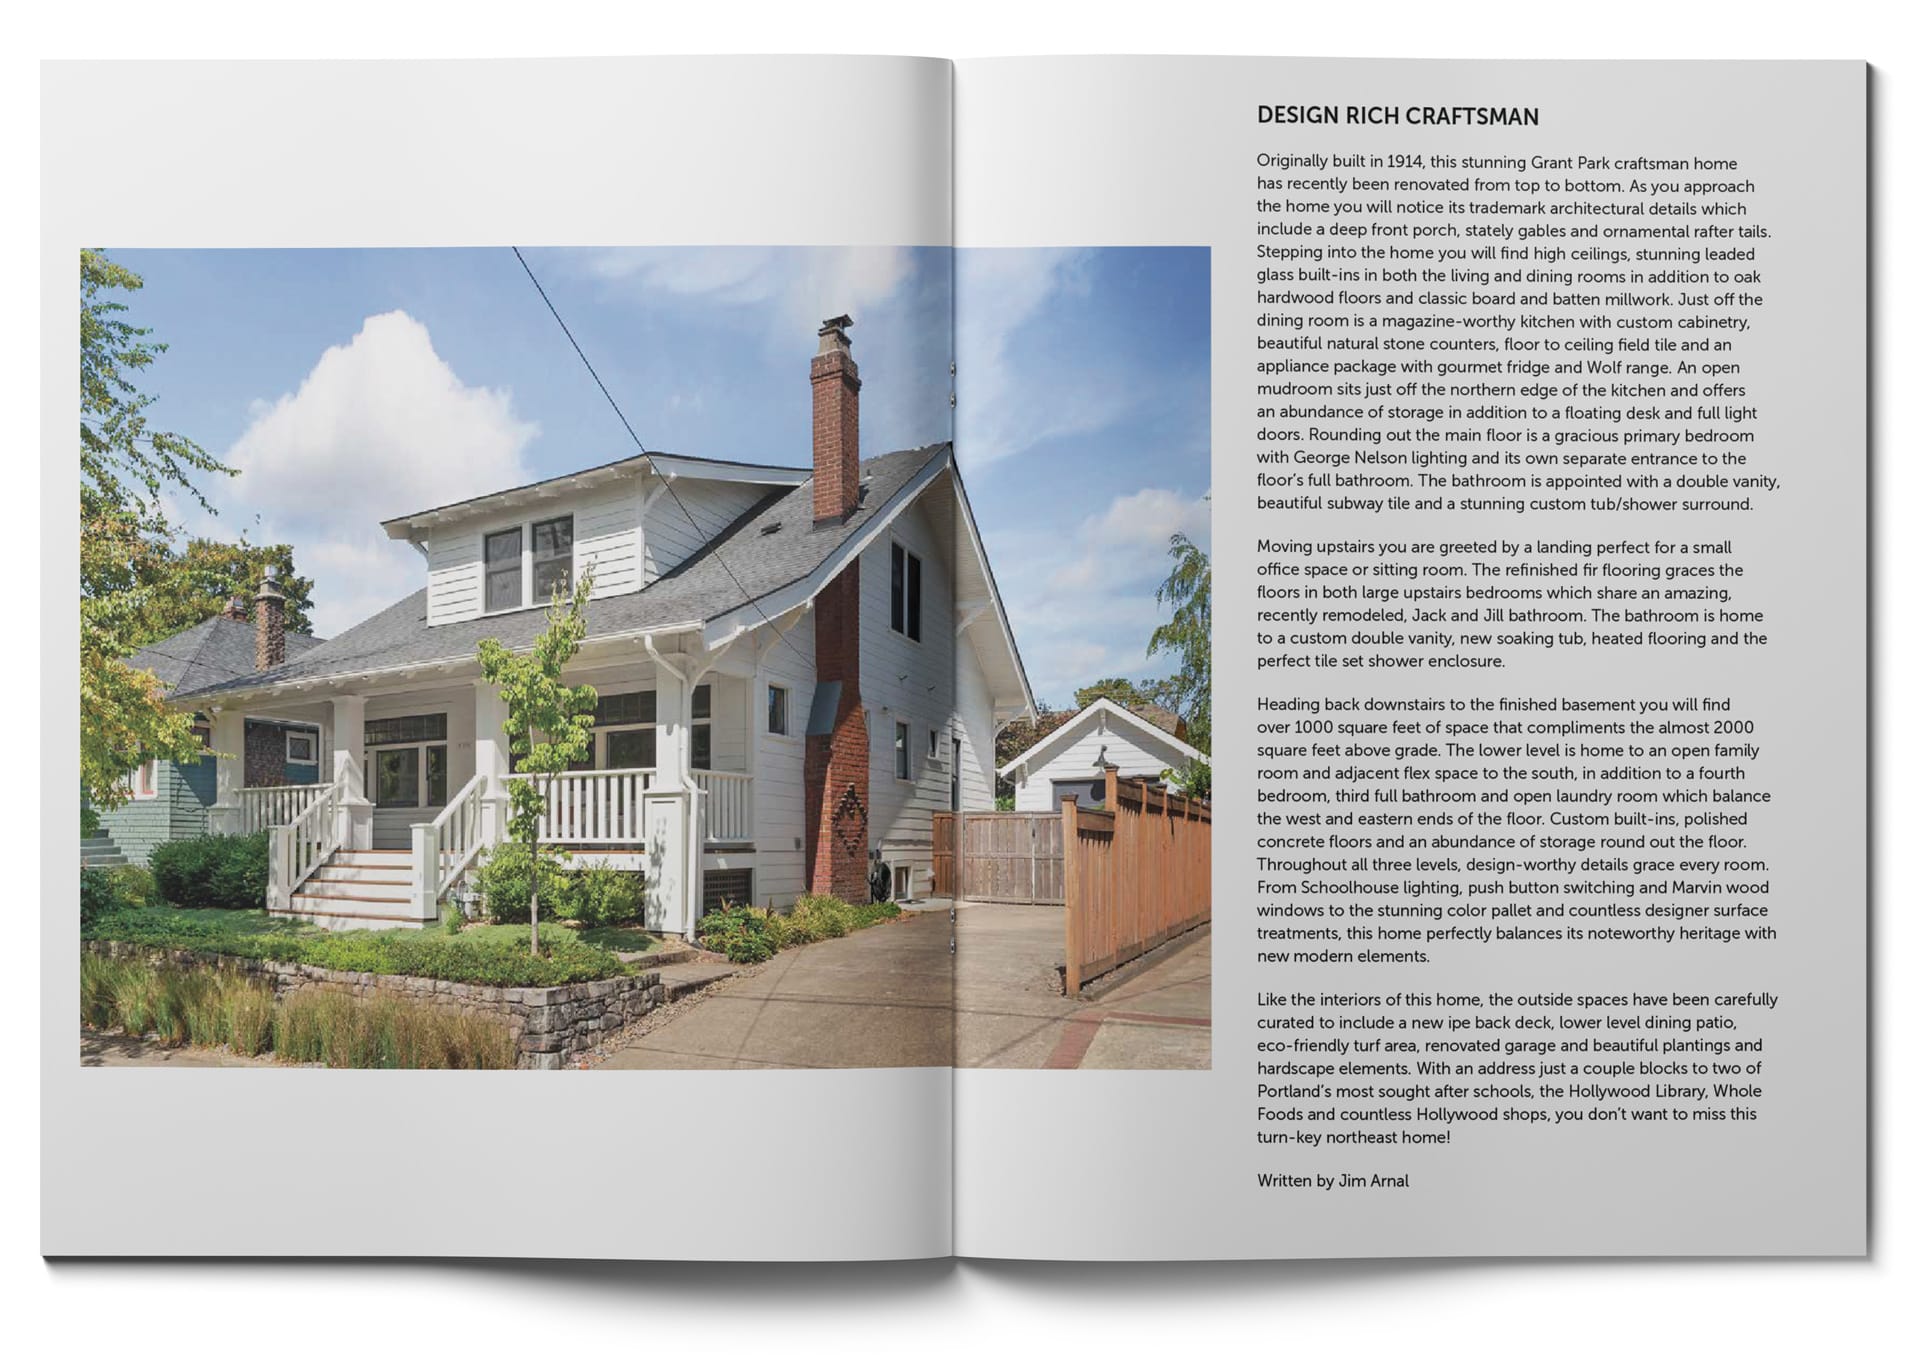
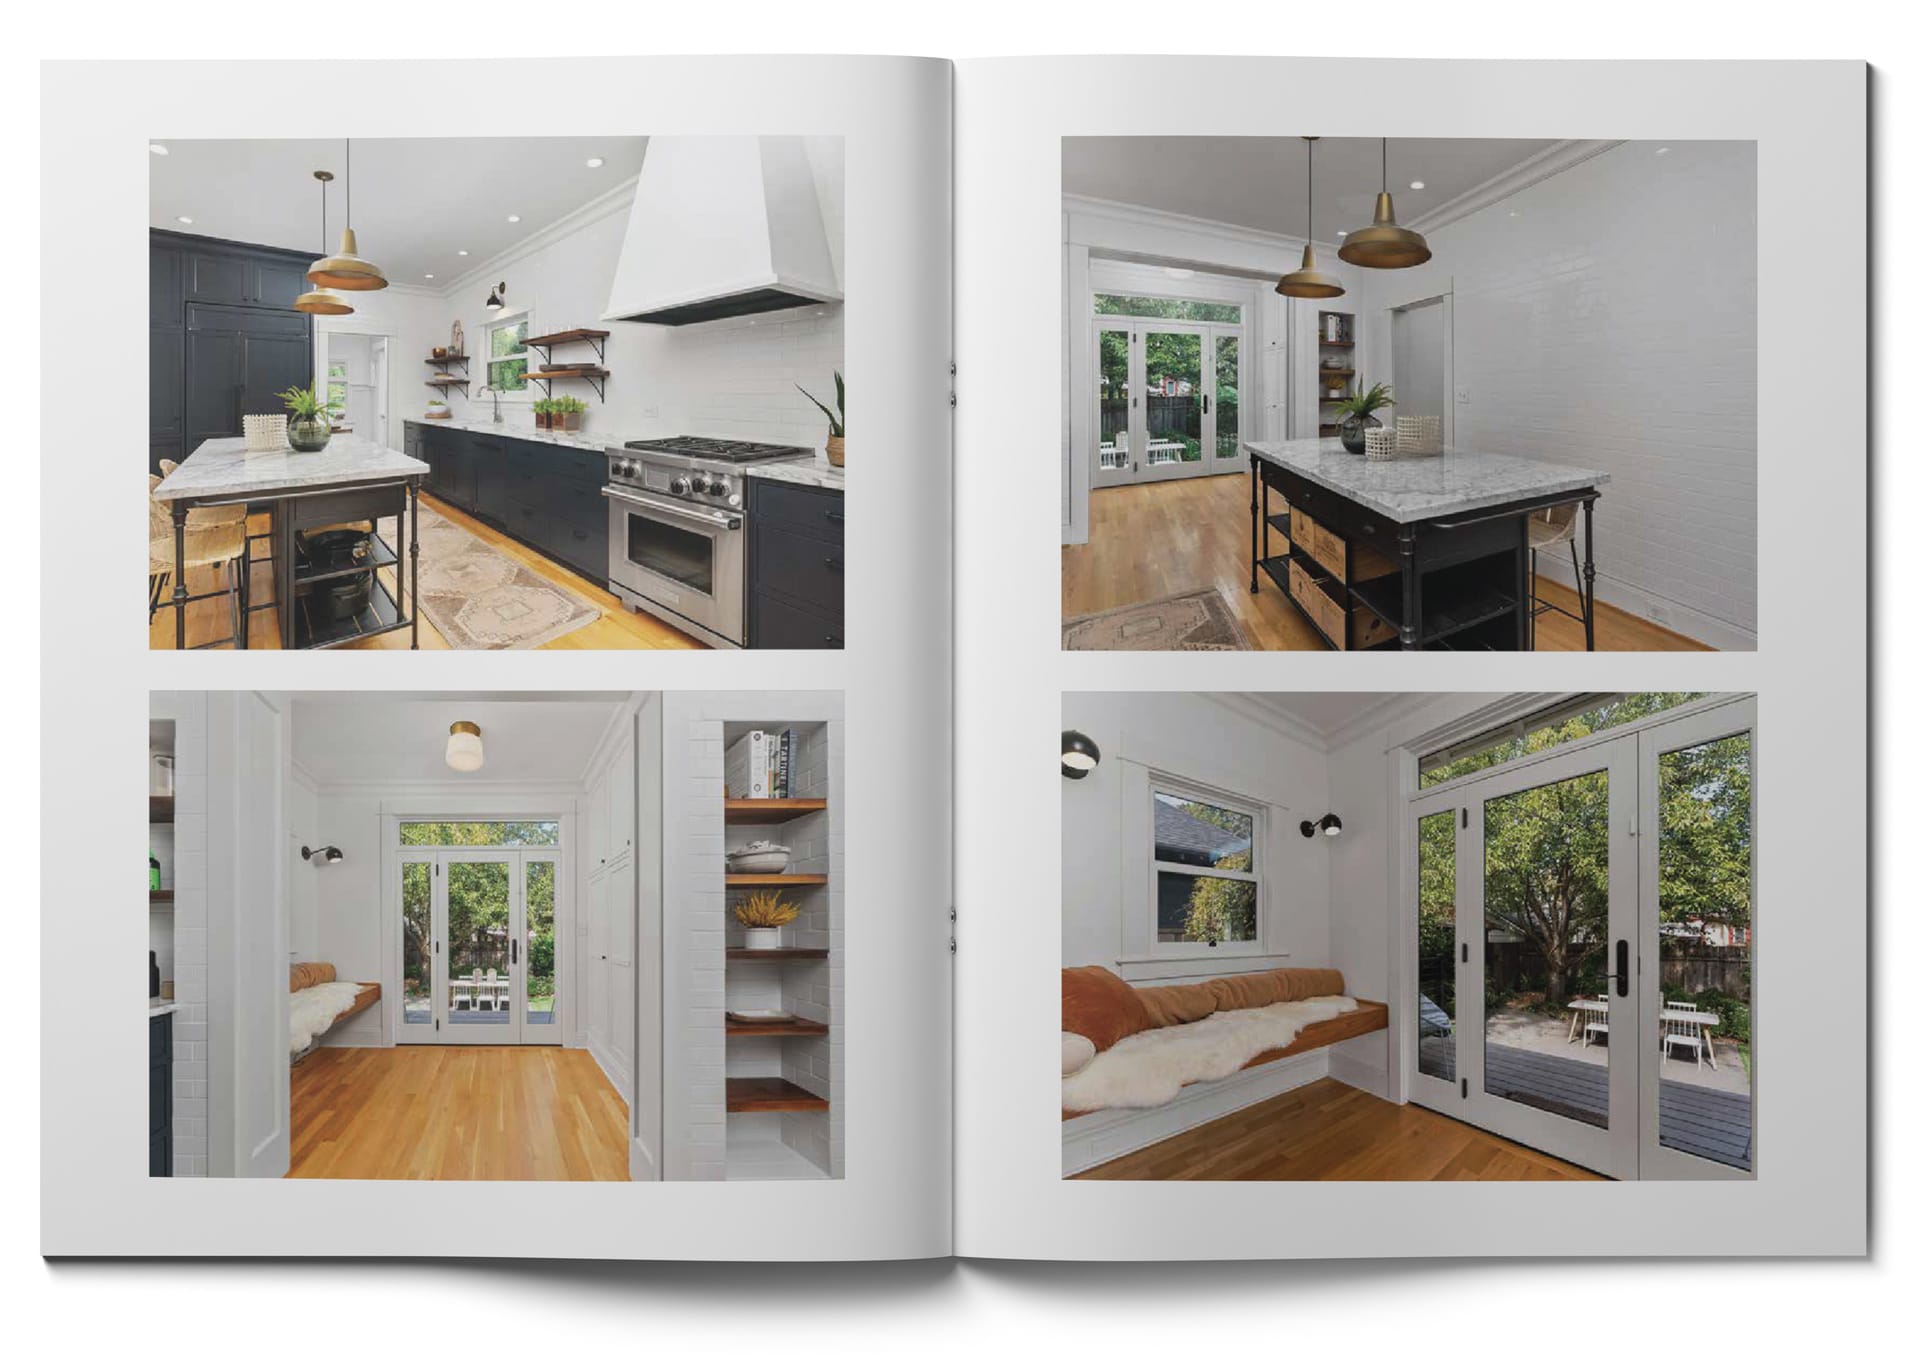
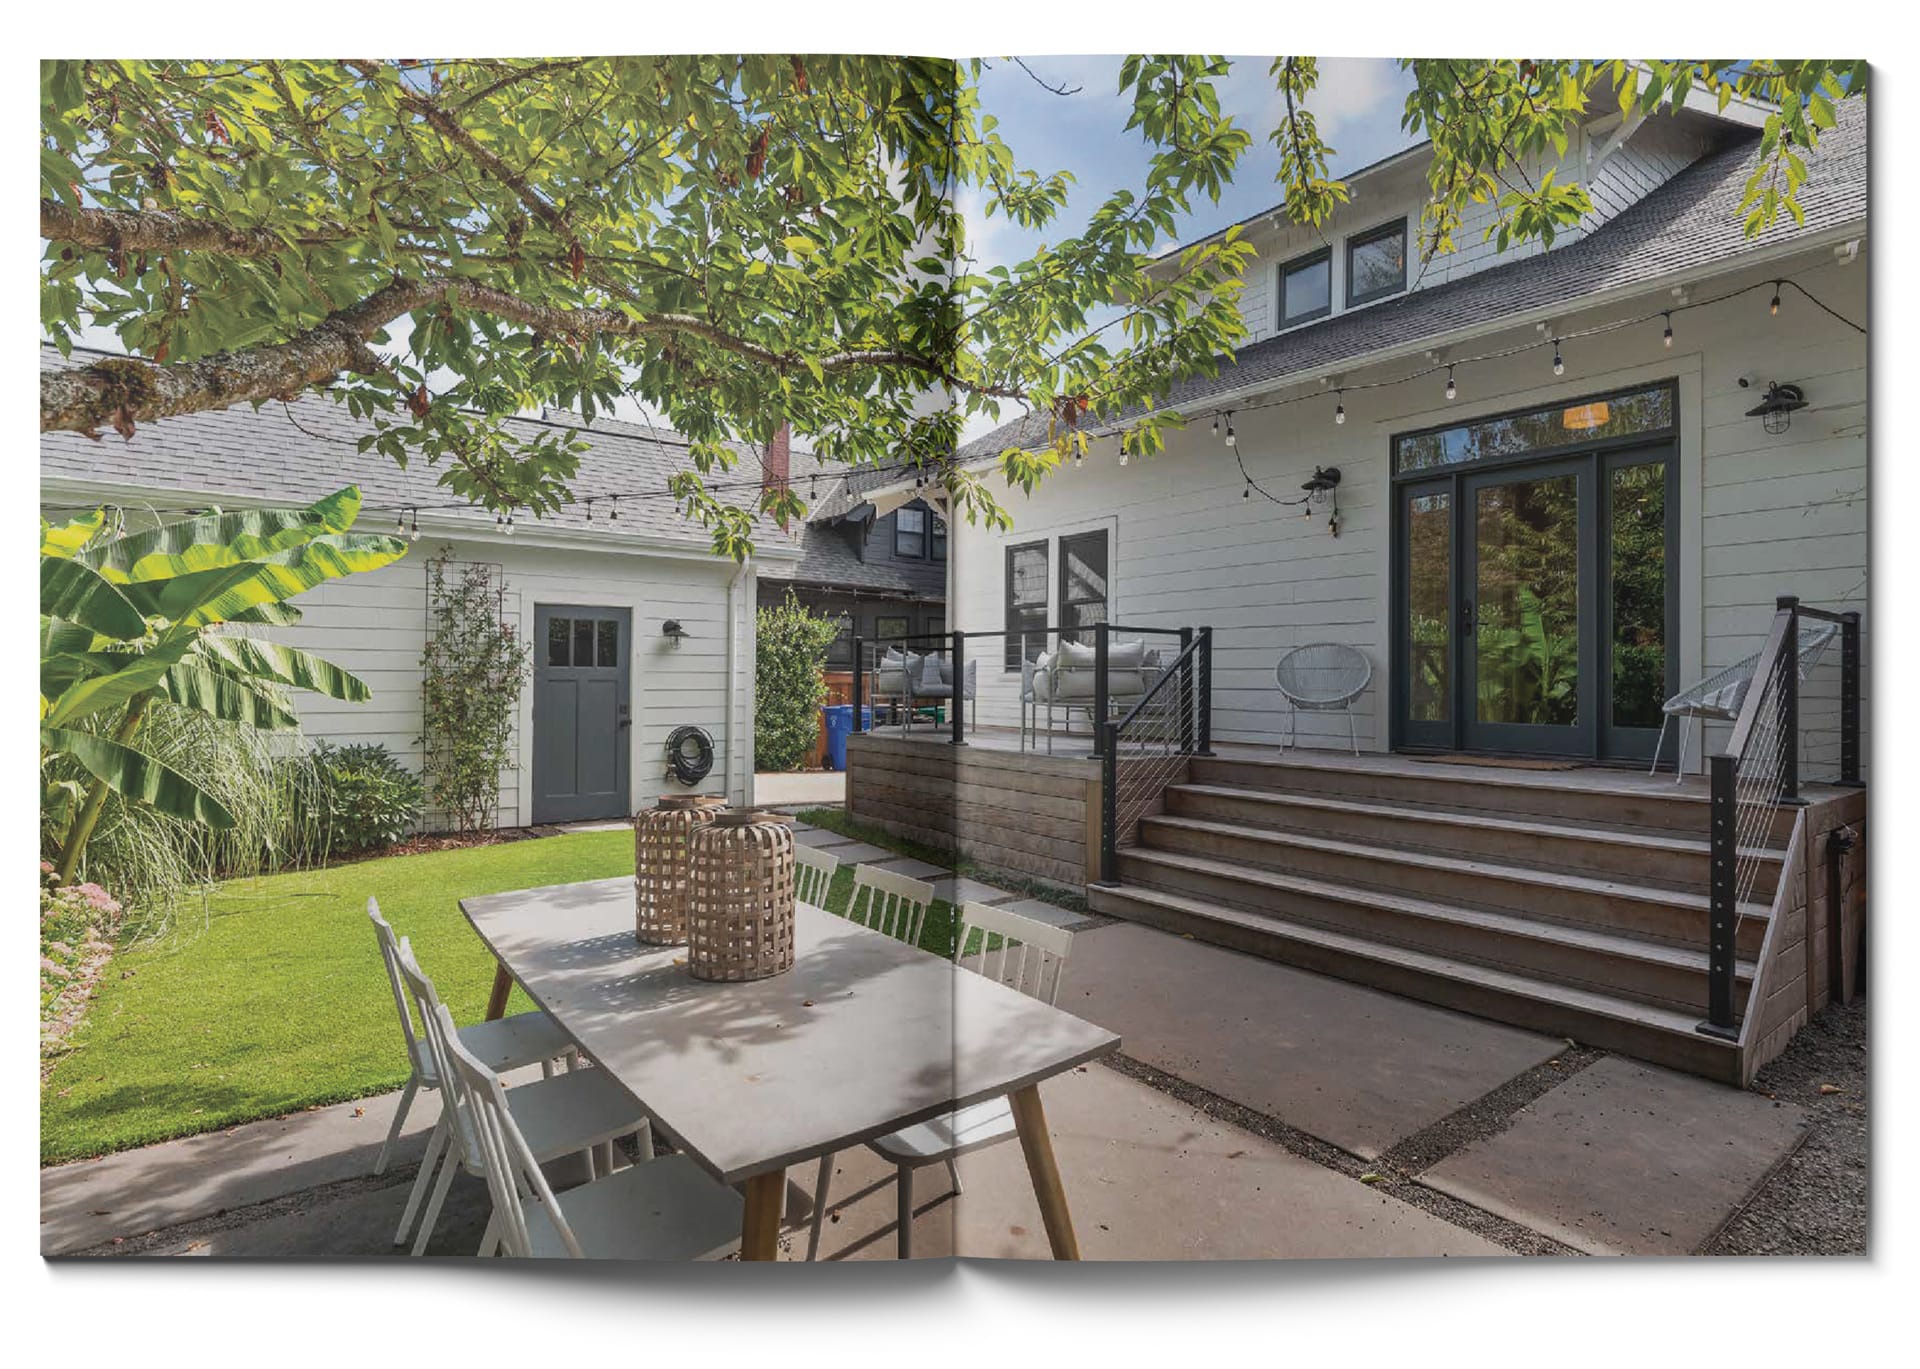
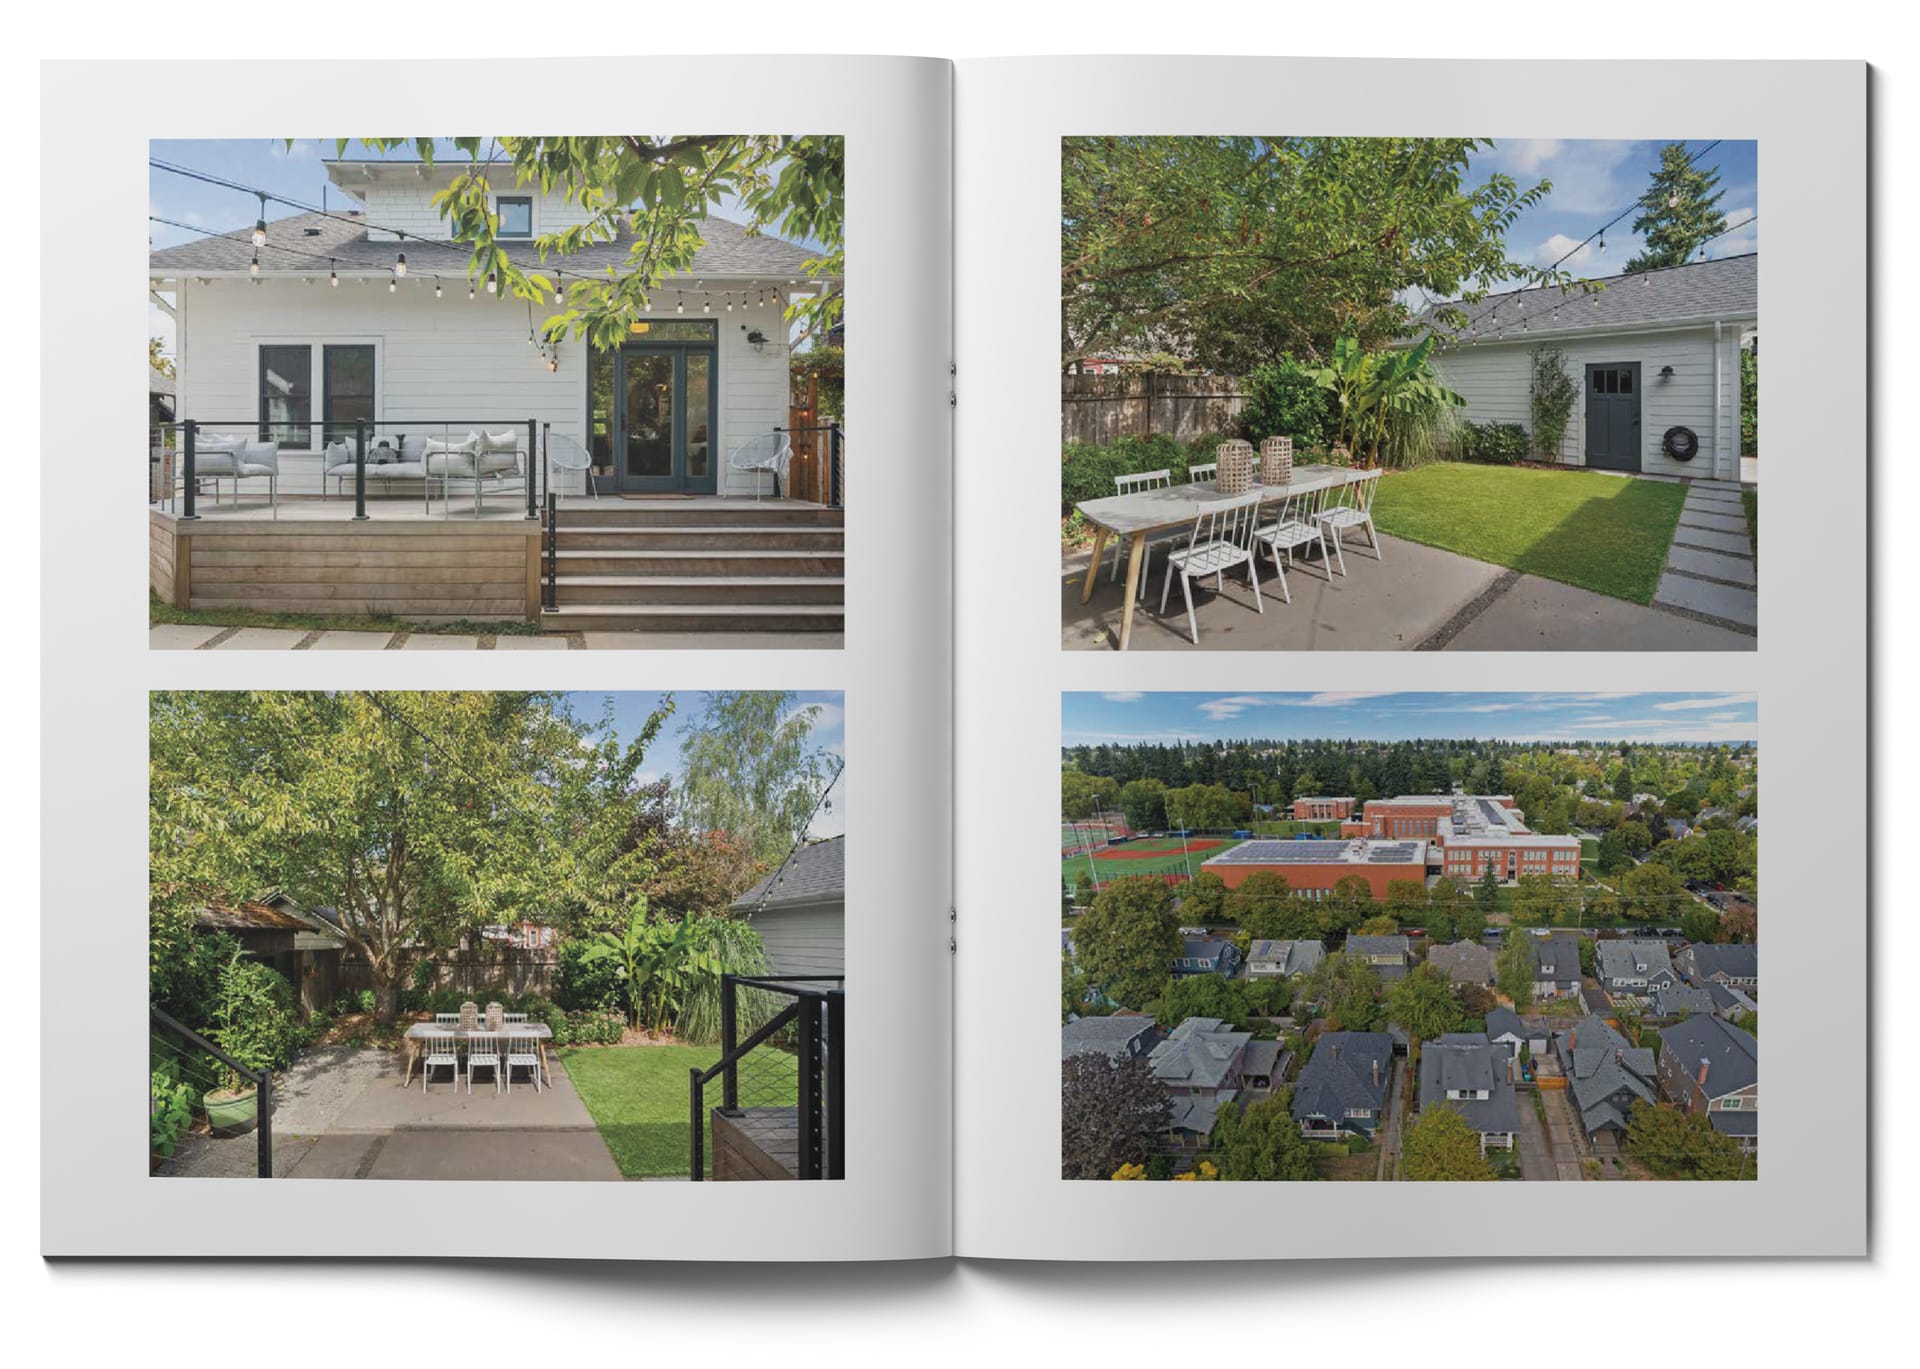
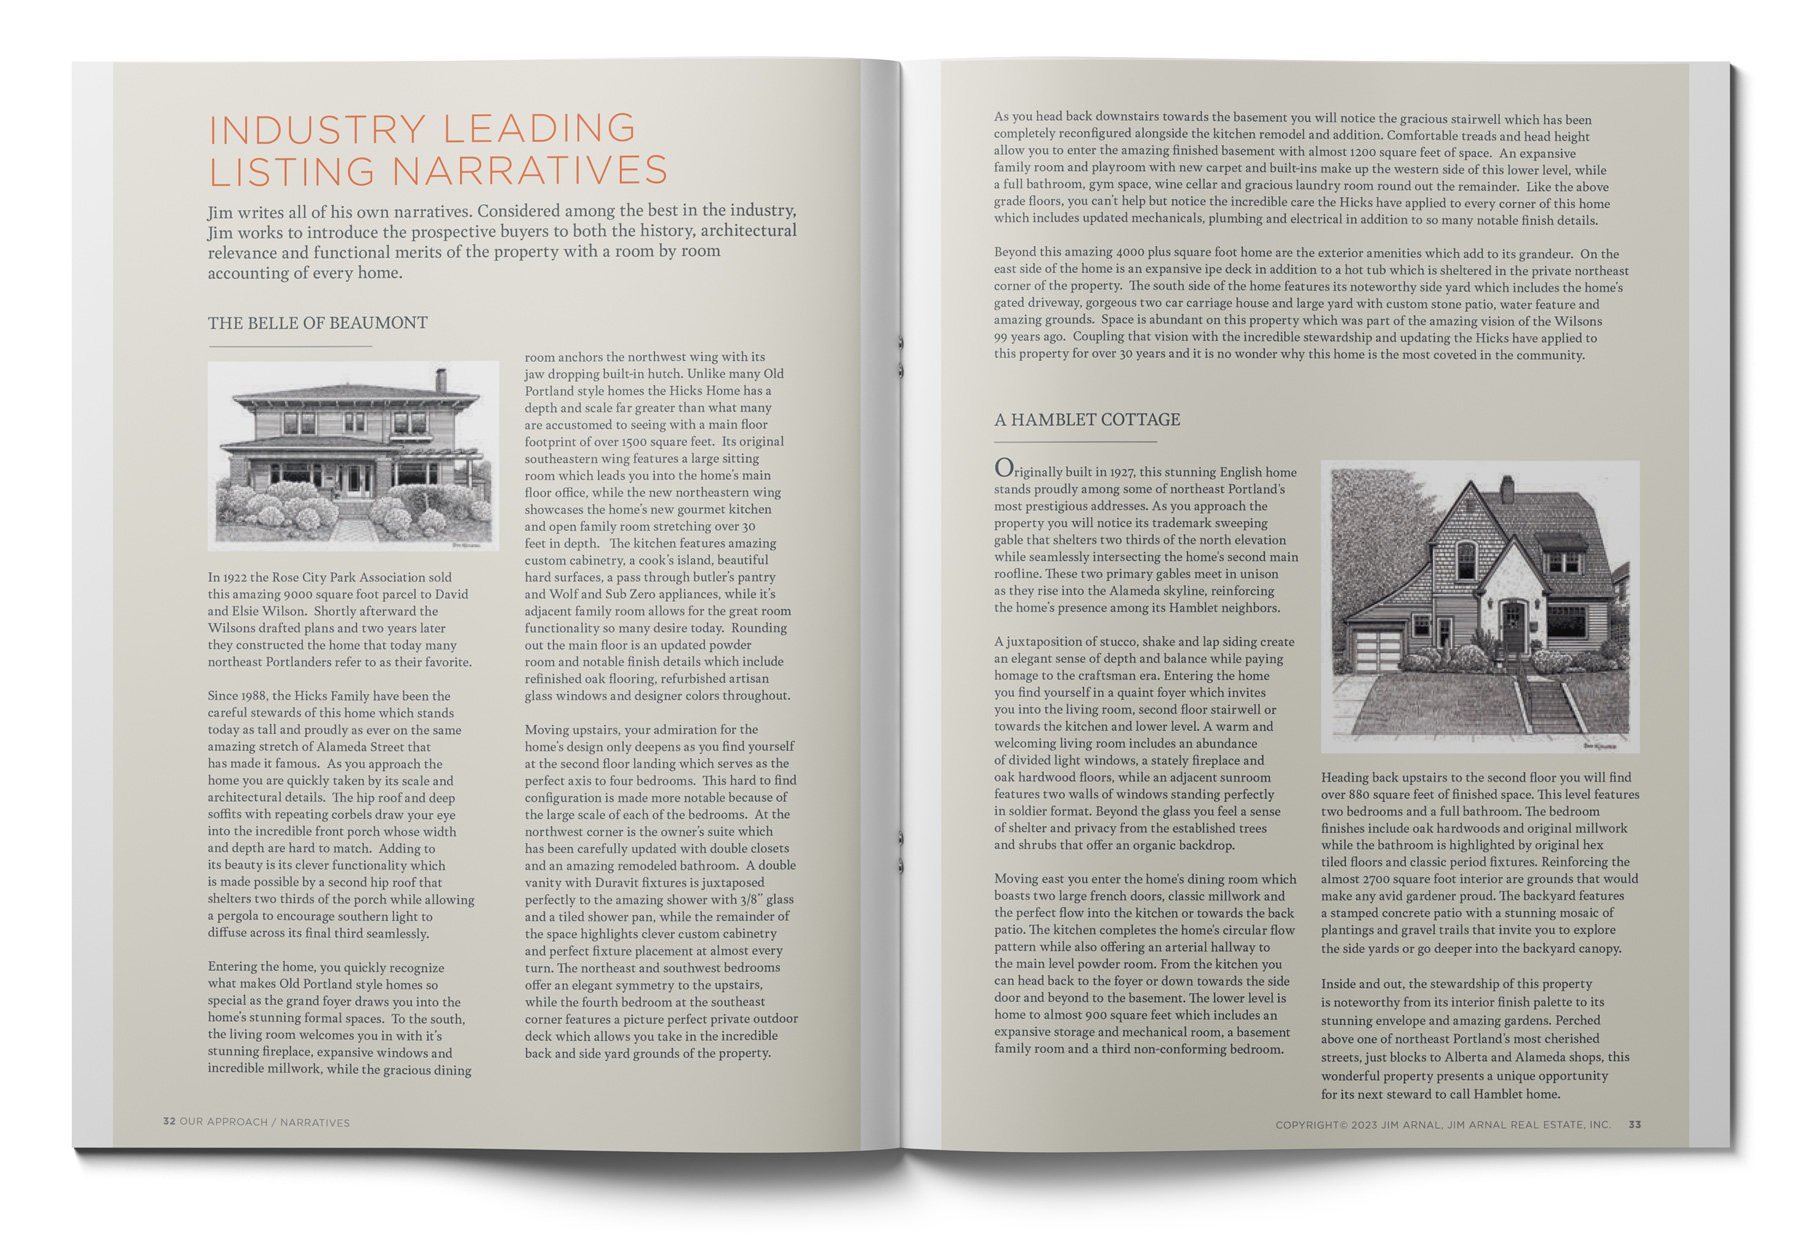
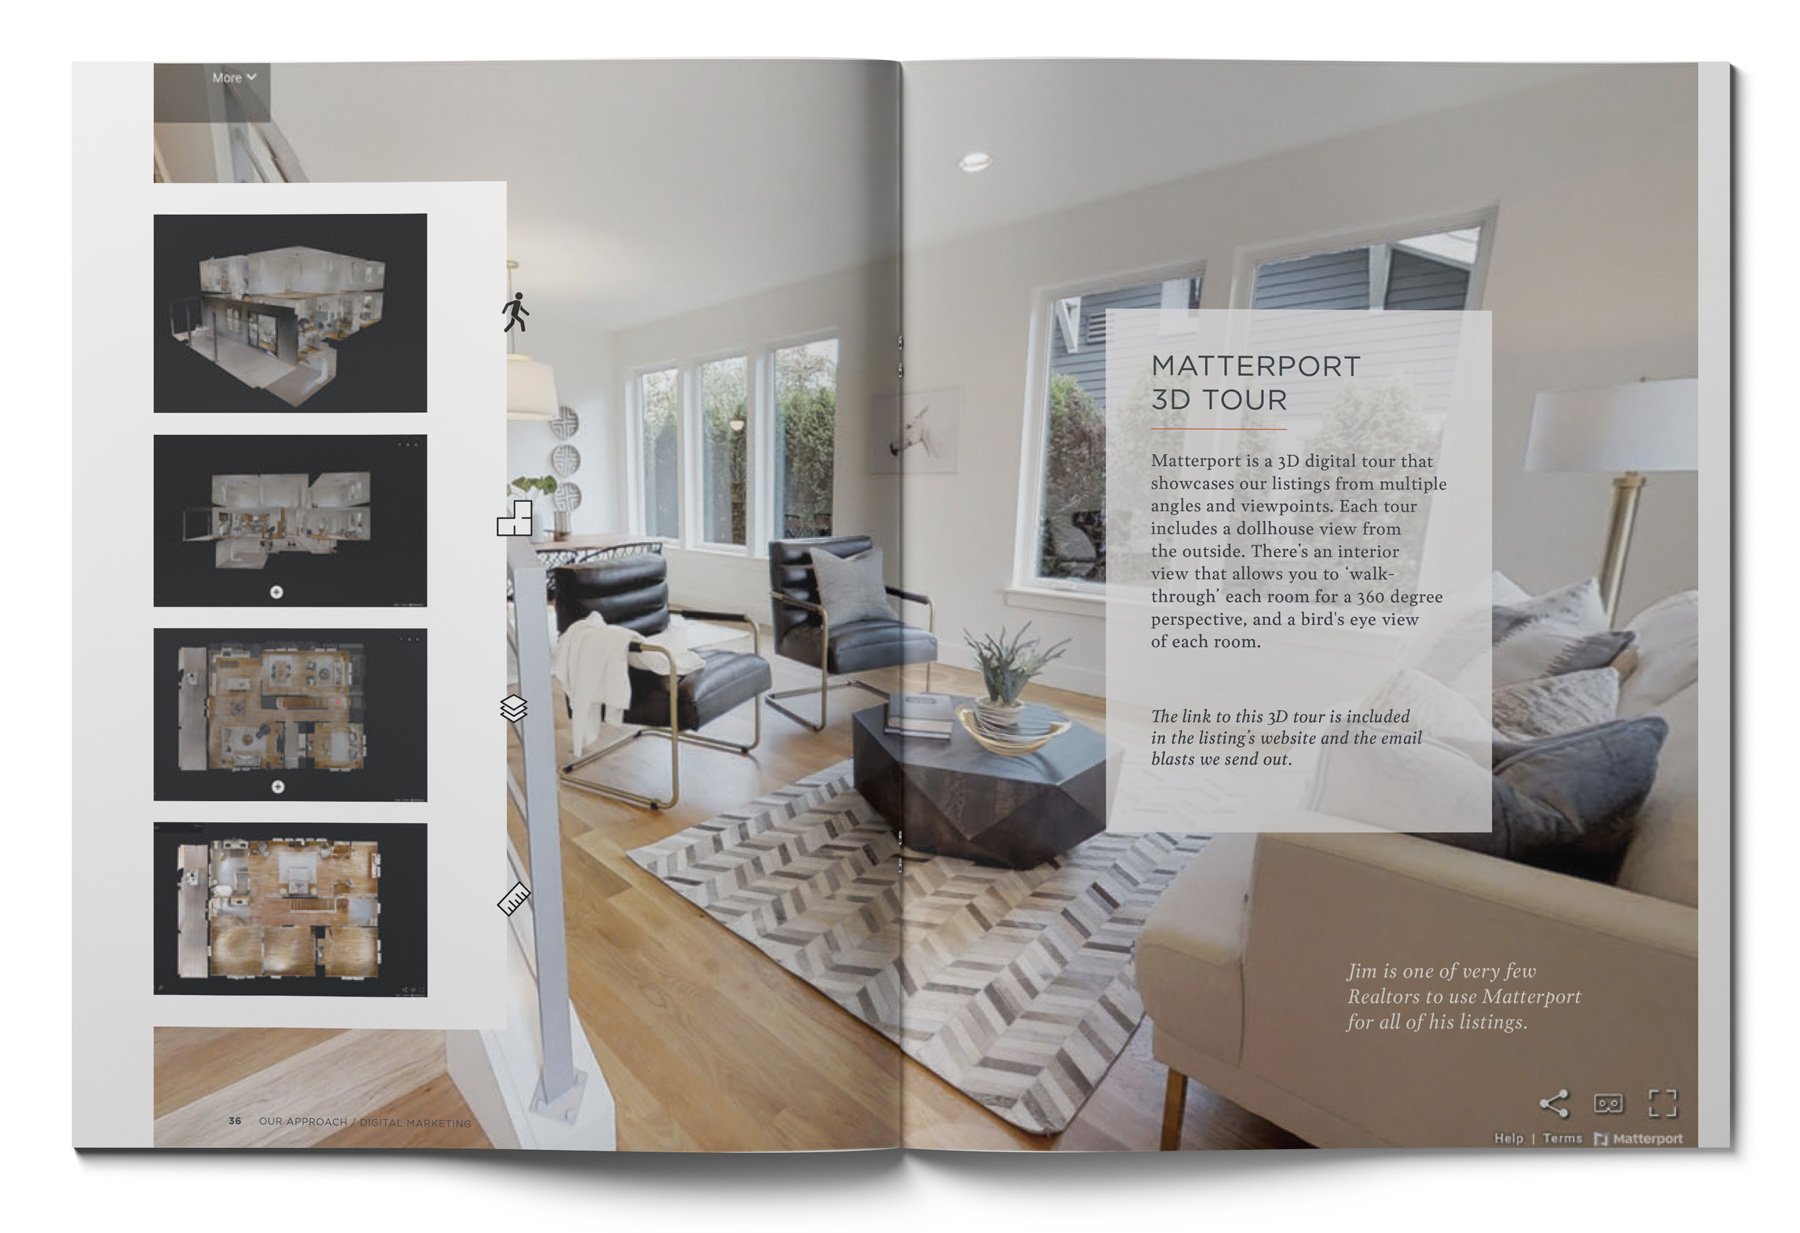
Take a peak into one of the Magazines Jim creates for each of his listings!
Jim's Listings By Home Price
2020-2024
*Career Statistics are available in Jim’s Seller’s Guide
This graph shows the various price ranges that Jim’s listings have represented since 2020.
Jim’s career numbers are less insightful since the Portland market has appreciated so much over his 20+ year career.
Jim Arnal’s listing statistics are arguably the strongest in the industry and his marketing portfolio stands as the most robust in the Portland market.
Jim's Market Time Average's (CAREER - 2003 through 2024)
Homes Listed: 300+ | Sold at or Above Asking Price: 203 | Homes that Did Not Appraise: 1*
*Jim was able to resolve appraisal and house still closed on time.
Homes Sold in a Week or Less
Homes Sold in 2 Weeks or Less
Homes Sold in 3 Weeks or Less
Homes Sold in 1 Month or Less
JIM'S Career (21 years) Averages
AVERAGE Career Sales Price: $743,821
JIM'S 2024 (Current) Averages
Days on Market: 6 | Sales Price: $973,509
What Sellers are Saying
JIM'S CLIENTS RECEIVE HIS EXTENSIVE SELLER'S GUIDE
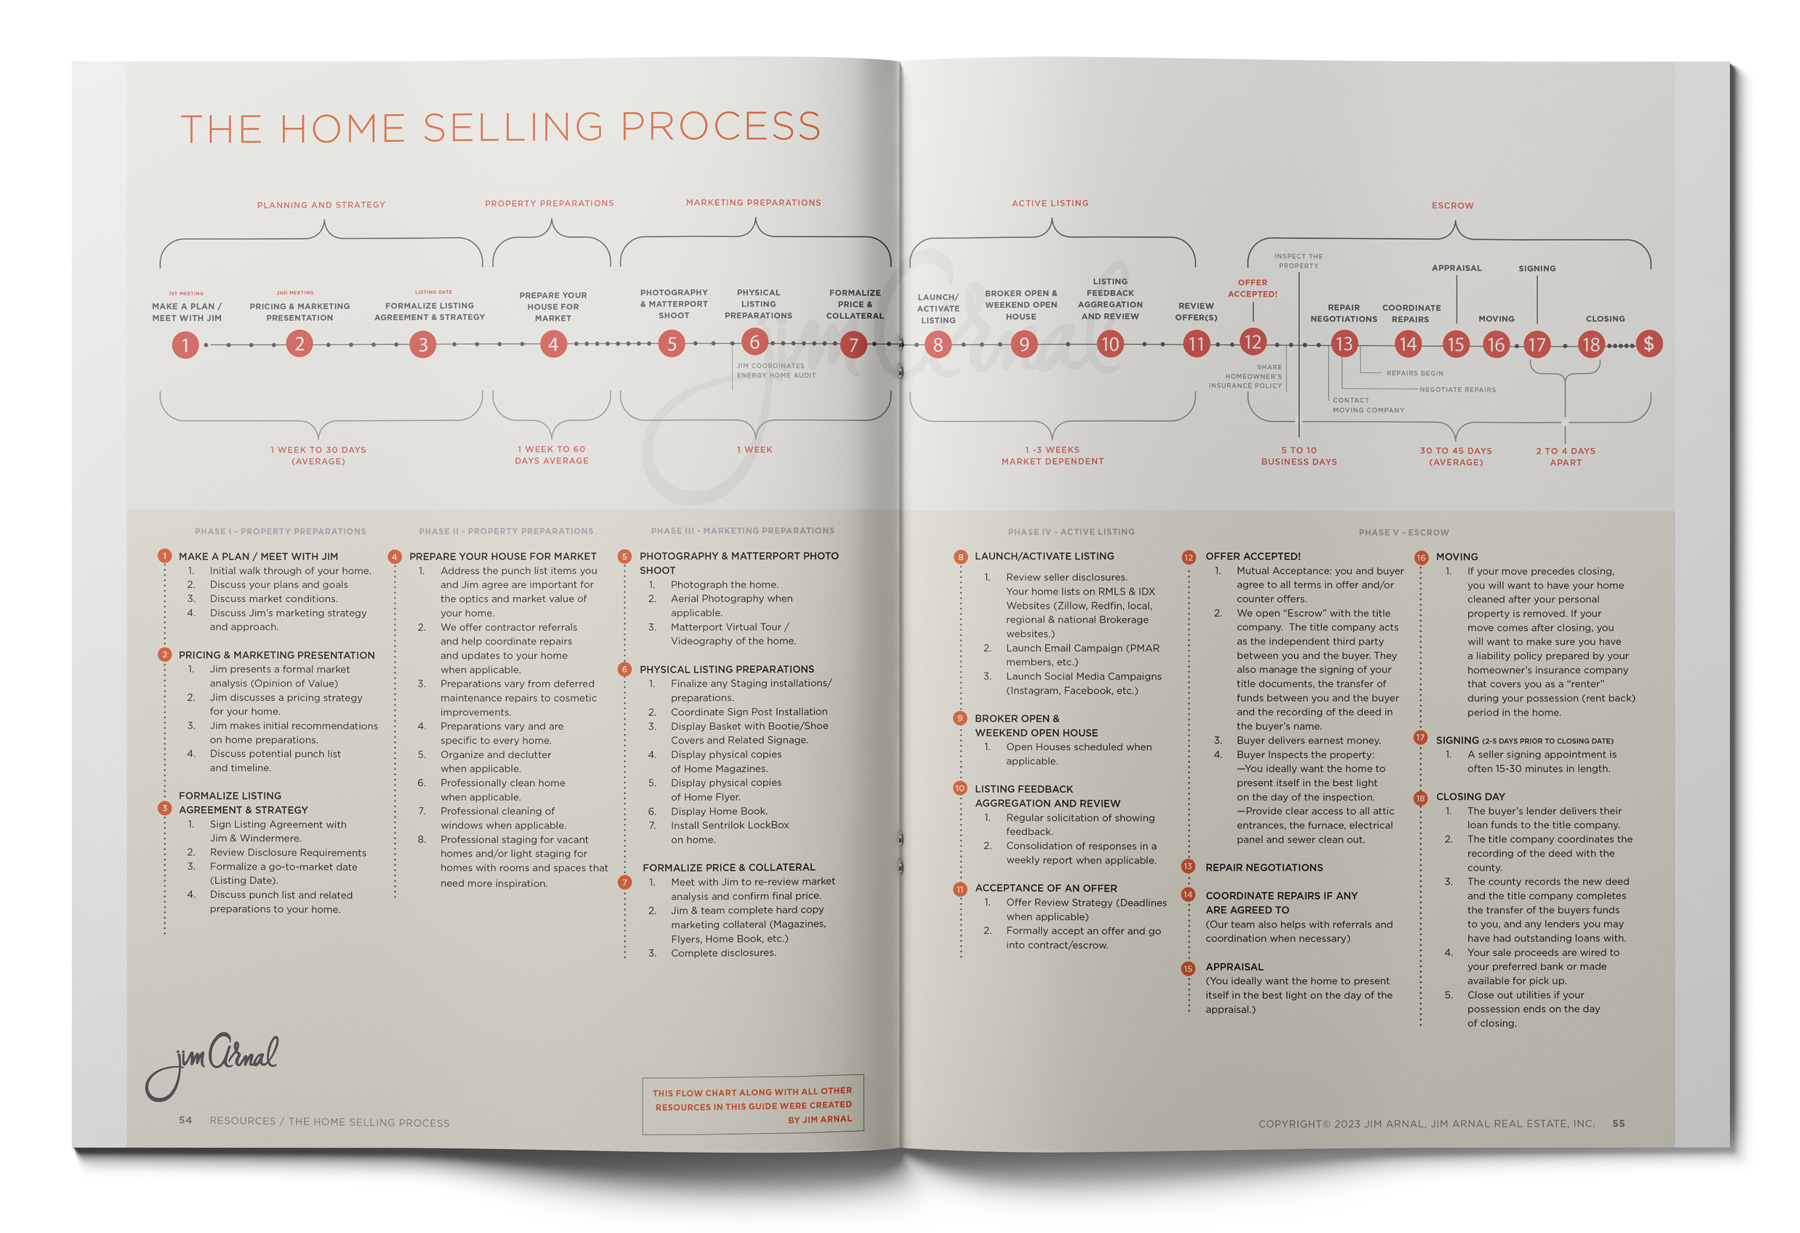
Jim spent several years developing his Seller’s Guide as a resource for his clients to not only understand what he and his team do to market their homes, but to serve as a ongoing reference guide to the process, from the preparation phase to closing.
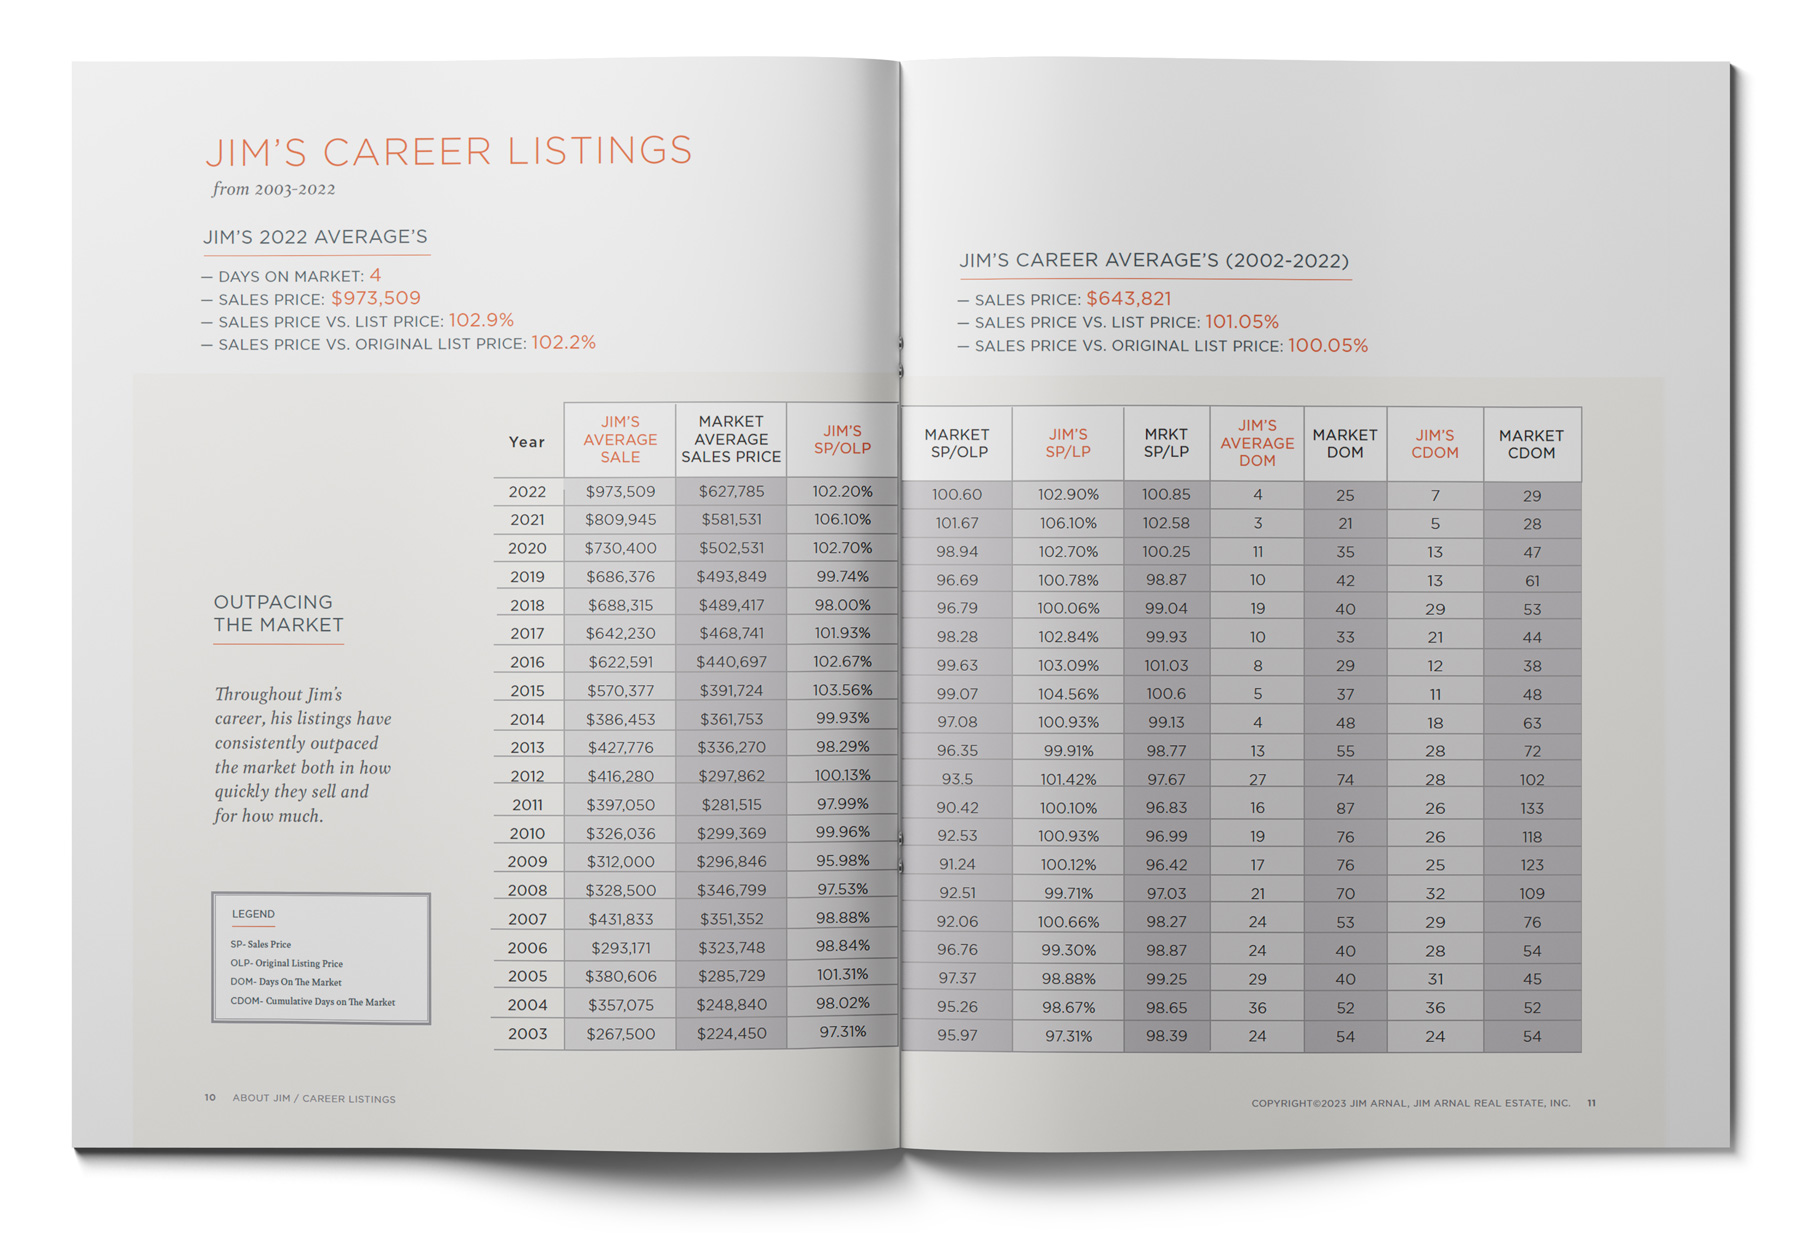
Here is how Jim's Sales Statistics compare to the market year over year.
| JIM’S AVERAGE SALE | MARKET AVERAGE SALES PRICE | JIM’S SP/OLP | MARKET SP/OLP | JIM’S SP/LP | MRKT SP/LP | JIM’S AVERAGE DOM | MARKET DOM | JIM’S CDOM | MARKET CDOM | |
|---|---|---|---|---|---|---|---|---|---|---|
| 2024 | $975,923 | $621,273 | 101.12% | 97.22 | 102.82% | 99.52 | 3 | 44 | 6 | 55 |
| 2023 | $984,666 | $608,059 | 102.52% | 97.24 | 102.52% | 99.53 | 4 | 37 | 4 | 48 |
| 2022 | $973,509 | $627,785 | 102.20% | 100.6 | 102.90% | 100.85 | 8 | 25 | 12 | 29 |
| 2021 | $809,945 | $581,531 | 106.10% | 101.67 | 106.10% | 102.58 | 9 | 21 | 11 | 28 |
| 2020 | $730,400 | $502,531 | 102.70% | 98.94 | 102.70% | 100.25 | 13 | 35 | 13 | 47 |
| 2019 | $686,376 | $493,849 | 99.74% | 96.69 | 100.78% | 98.87 | 10 | 42 | 13 | 61 |
| 2018 | $688,315 | $489,417 | 98.00% | 96.79 | 100.06% | 99.04 | 19 | 40 | 29 | 53 |
| 2017 | $642,230 | $468,741 | 101.93% | 98.28 | 102.84% | 99.93 | 10 | 33 | 21 | 44 |
| 2016 | $622,591 | $440,697 | 102.67% | 99.63 | 103.09% | 101.03 | 8 | 29 | 12 | 38 |
| 2015 | $570,377 | $391,724 | 103.56% | 99.07 | 104.56% | 100.6 | 5 | 37 | 11 | 48 |
| 2014 | $386,453 | $361,753 | 99.93% | 97.08 | 100.93% | 99.13 | 4 | 48 | 18 | 63 |
| 2013 | $427,776 | $336,270 | 98.29% | 96.35 | 99.91% | 98.77 | 13 | 55 | 28 | 72 |
| 2012 | $416,280 | $297,862 | 100.13% | 93.5 | 101.42% | 97.67 | 27 | 74 | 28 | 102 |
| 2011 | $397,050 | $281,515 | 97.99% | 90.42 | 100.10% | 96.83 | 16 | 87 | 26 | 133 |
| 2010 | $326,036 | $299,369 | 99.96% | 92.53 | 100.93% | 96.99 | 19 | 76 | 26 | 118 |
| 2009 | $312,000 | $296,846 | 95.98% | 91.24 | 100.12% | 96.42 | 17 | 76 | 25 | 123 |
| 2008 | $328,500 | $346,799 | 97.53% | 92.51 | 99.71% | 97.03 | 21 | 70 | 32 | 109 |
| 2007 | $431,833 | $351,352 | 98.88% | 92.06 | 100.66% | 98.27 | 24 | 53 | 29 | 76 |
| 2006 | $293,171 | $323,748 | 98.84% | 96.76 | 99.30% | 98.87 | 24 | 40 | 28 | 54 |
| 2005 | $380,606 | $285,729 | 101.31% | 97.37 | 98.88% | 99.25 | 29 | 40 | 31 | 45 |
| 2004 | $357,075 | $248,840 | 98.02% | 95.26 | 98.67% | 98.65 | 36 | 52 | 36 | 52 |
| 2003 | $267,500 | $224,450 | 97.31% | 95.97 | 97.31% | 98.39 | 24 | 54 | 24 | 54 |
SP- Sales Price | OLP- Original Listing Price | DOM- Days On The Market | CDOM- Cumulative Days on The Market
* The stats shown here are from RMLS (Regional Multiple Listing Service).
After over 20 years representing homeowners from all walks of life and across dozens of Portland’s neighborhoods and suburbs, I have created a comprehensive set of tools and resources which in part are outlined on this website. The goal of the guides and this website are to offer my clients three critical pieces of information. The first is a background on my practice and approach, highlighting examples of my track record, the materials I produce and the services my team offers. The second is a series of resources that relate specifically to the process of selling your home, giving you a step by step look at what you can expect and what tools we provide as we steward you through the sales process. The final goal of my guides and this website is to give you information which relates to Portland, what our city’s real estate landscape looks like and how our market has performed historically, in your community and beyond. My goal as a Realtor is to provide the highest level of service possible by employing the best tools and services available while leveraging my 20 plus years of experience. I am committed to presenting every home I represent in its best light so I can meet and ideally exceed my clients’ goals while making the process as smooth as possible. I hope you find this website and the resources herein helpful. Please don’t hesitate to reach out if you are considering selling or buying in the Portland metro. – Jim Arnal
